Web Analytics
< back

Lyst | Site Behaviour Data Visualisation

London, 2014

Our Services


Production

Concept Development

Design

01. Challenge - 'Make Data Digestible'  


For an exclusive press event, leading fashion website, Lyst, turned to Holition to create an artistic projection to showcase the vast amount of big data constantly moving through Lyst's platform at any given time.

Lyst

"Certainly more eye-catching and stylish than an Excel spreadsheet" 


- Elizabeth Paton, Financial
Times.

02. Solution - Not Just A Piece of Art


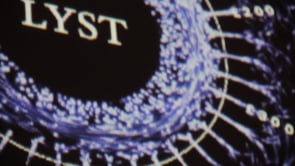
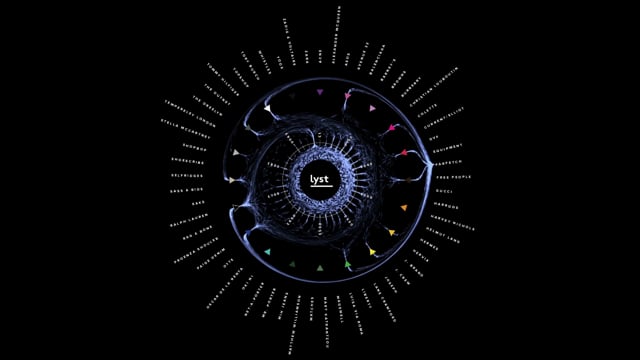
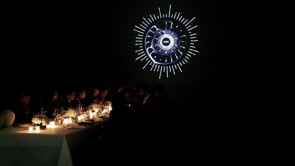
Through clever coding and creative thinking, Holition produced a circular visualisation that amalgamated the behavioural patterns across the site. Despite it's seemingly simple appearance, the visualisation fed the 250,000+ items of clothing and accessories that were on the screen at any one time into its form, surfacing popular trends and aggregating valuable data that were eventually used internally to inform sales and marketing decisions.

drawing copy

lyst4

Data Visualisation for Lyst

03. Insight - Great Data, Better Decisions


Much more than simply a backdrop for a lavish dinner, the visualisation showcased prized information about behavioural patterns on the site, which were then sold back to the partner brands on the site as a set of more informed decision making tools. The insights were so successful that Lyst then created an entire dedicated team to interpretting the insights and channeling the 'dashboard' as a sales tool.

lyst3

lyst2

Lyst - Behind The Scenes

"Data doesn't look like this... This is beautiful!"